

Fuel, convenience + gaming
One location. Three businesses. A clearer path to the next one.
An illustrative family-owned gas-station franchise operates along the Dallas–Austin corridor. Its locations combine gasoline and diesel pumps, convenience stores, and games of skill or strategy, potentially alongside other gaming formats. Expansion starts with understanding how those activities perform separately and together.
What makes a location successful—and where could that operating model work next?
Establish the baseline
Reconcile historical results by location, reporting period, and operating shift. Bring together pump and store point-of-sale exports, fuel deliveries, supplier invoices, inventory records, gaming reports, operator settlements, payroll, merchant fees, and bank activity. Show missing records and timing differences before comparing performance.
Put the records to work
DBM can connect operating and financial records to their source documents, emails, invoices, and agreements. DTX uses that evidence to investigate exceptions, explain differences between locations, and build a repeatable review process. Source-system mappings, imports, and analytical views are scoped to the operator’s actual records.
Where a location uses an overnight gaming session, keep that session traceable across midnight. For example, 17:00–05:00 activity can be reviewed as one operating session while retaining actual transaction dates and reconciliation to the financial period. Confirm hours by location and game format.
Analyze one location as a connected business
Compare the contribution of each activity after its direct costs, then reconcile shared staffing, occupancy, utilities, and other overhead to the whole-site result. Make allocation assumptions visible so the same cost or sale is counted once.
- Does a fuel-pricing change generate enough additional store contribution to improve total site profit?
- Does evening gaming activity coincide with additional store purchases, and what remains after staffing, supplier shares, and other incremental costs?
- Which combination of product mix, staffing, equipment availability, and opening hours makes best use of the existing site?
- Would another location grow the group’s cash generation after opening costs, management travel, working capital, and any sales transferred from an existing site?
Use aggregated site-and-shift records, comparable periods, and pilot changes where practical. Distinguish observed relationships from demonstrated incremental sales before carrying an assumption into an expansion forecast.
- Growth variables to test together
- Gasoline and diesel volumes × margin · store conversion and basket mix · gaming mix and retained share · staffing and hours · site access and competition · opening investment and working capital
The connected operating picture
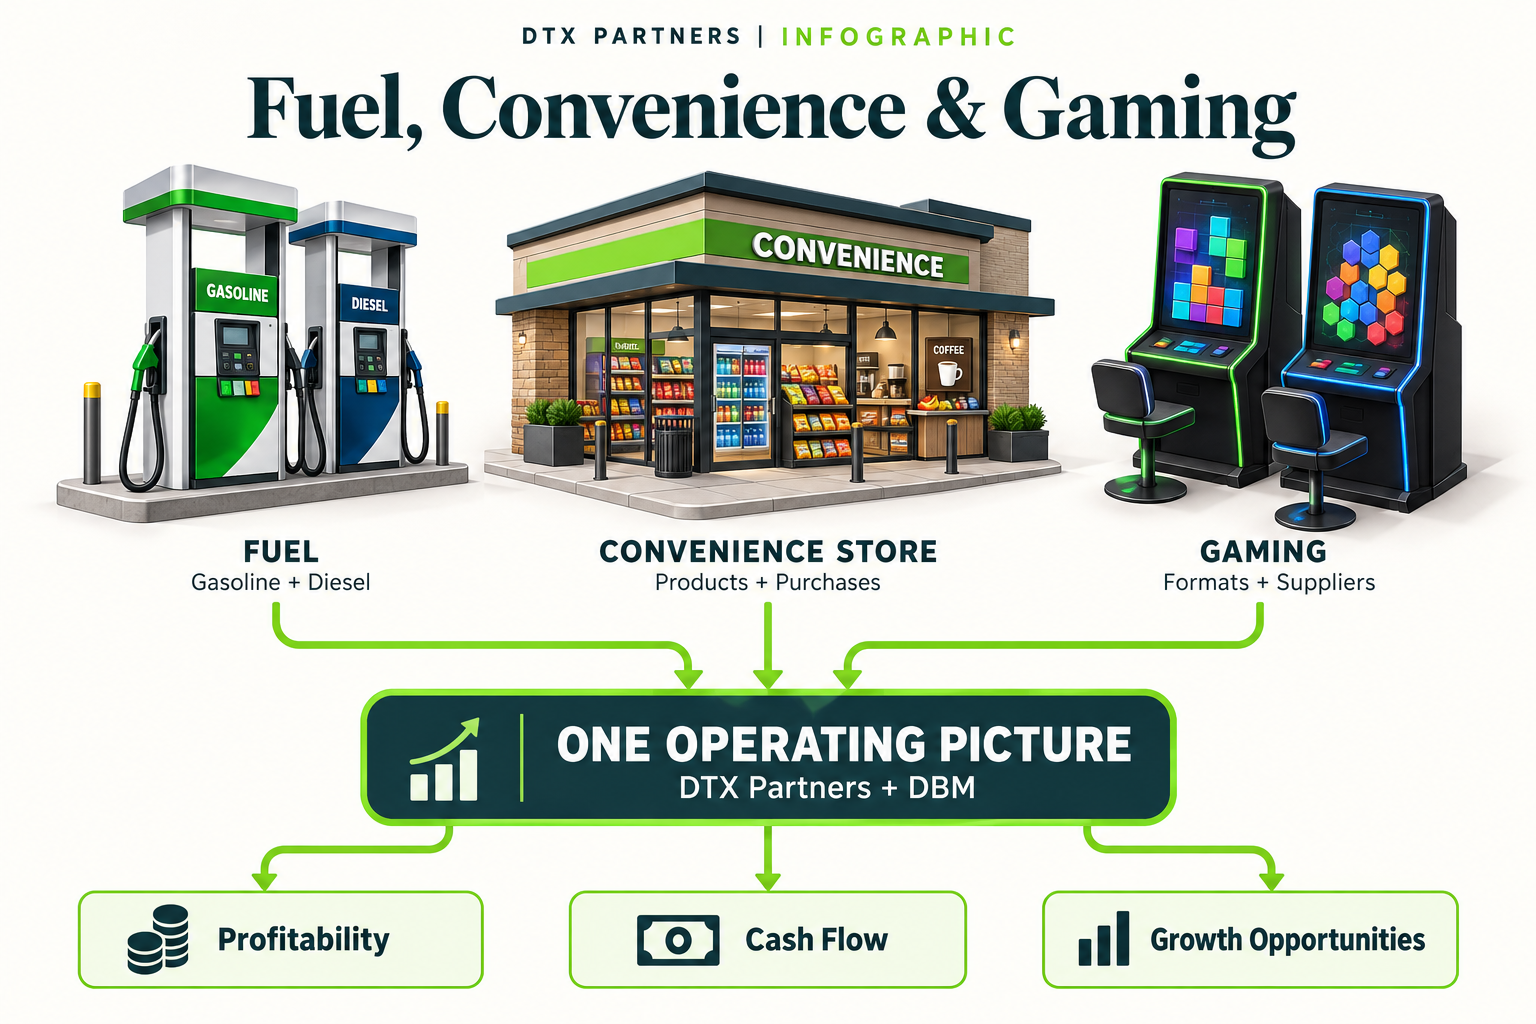
Three operations. One view of the business.
Bring fuel, convenience retail, and gaming into the same analysis. DTX Partners uses DBM’s evidence foundation to connect operating activity with profitability, cash flow, and growth decisions.
Multivariate growth analysis
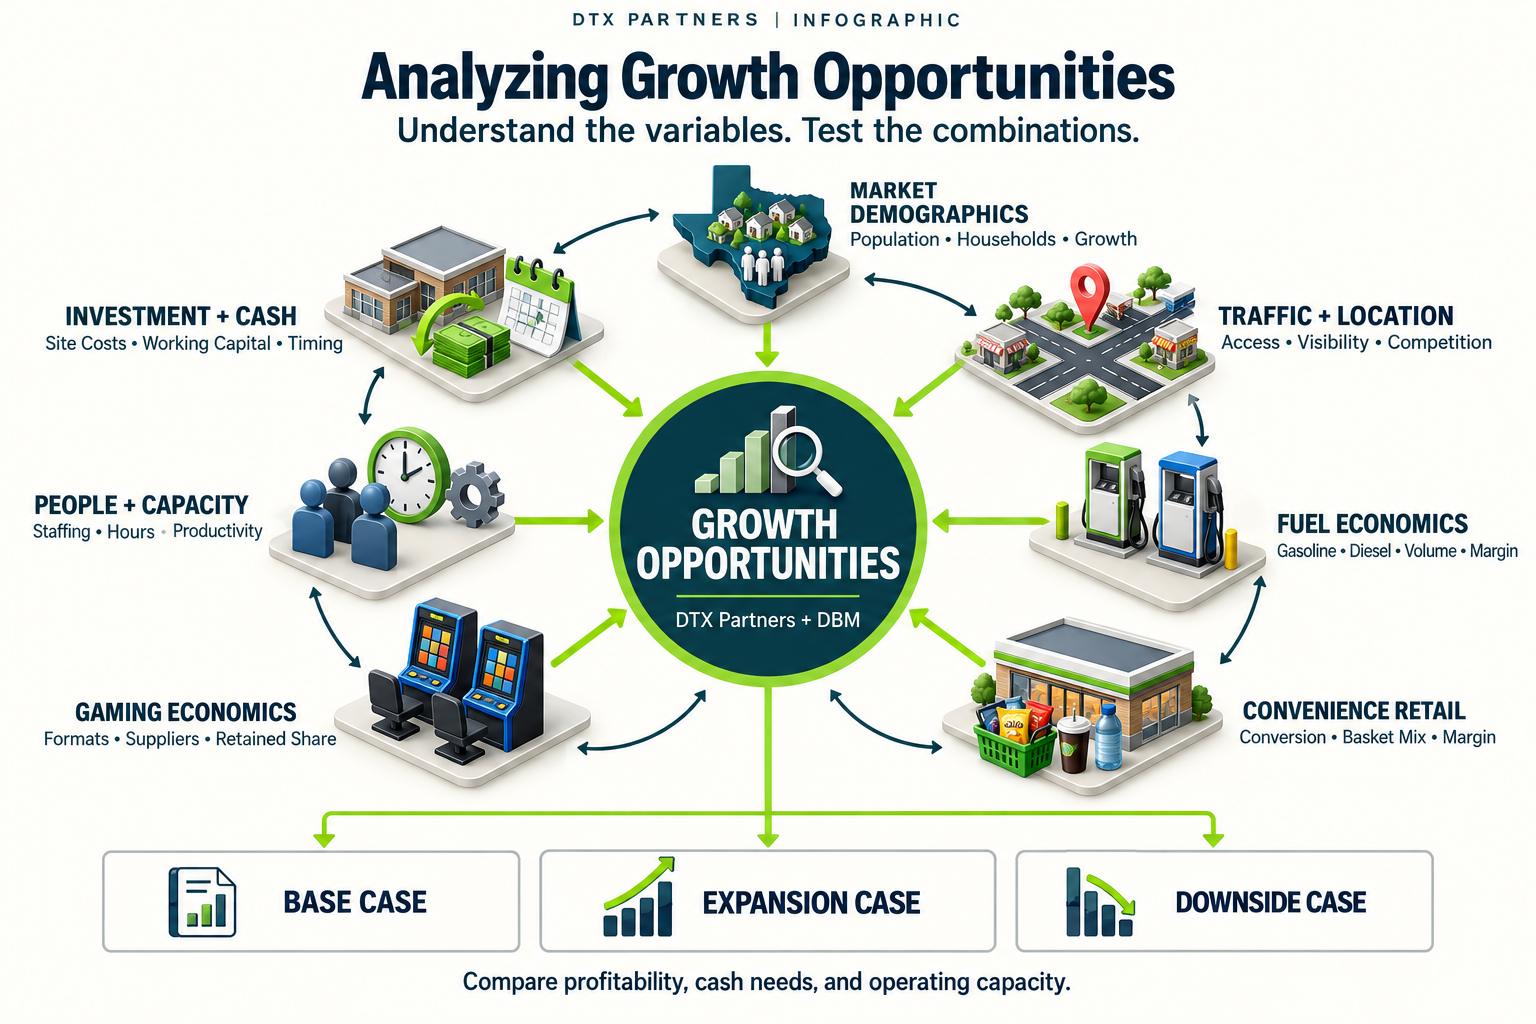
Test the combinations behind the next move.
Evaluate market demographics, traffic and location, fuel economics, convenience retail, gaming economics, people and capacity, and investment and cash together. Compare base, expansion, and downside cases to understand the tradeoffs.
- Urban (major markets) vs. rural (smaller markets): Compare growth in major urban markets with opportunities in smaller rural markets using a common framework: customer demand, traffic and access, competition, property costs, staffing, supplier coverage, and trade-area reach. Test how each location’s fuel, store, and gaming mix affects break-even sales, cash needs, and management capacity; include suburban markets and regional hubs as separate cases where appropriate.
Texas Demographic Market Screen
Use what works today to ask better questions about tomorrow’s locations.
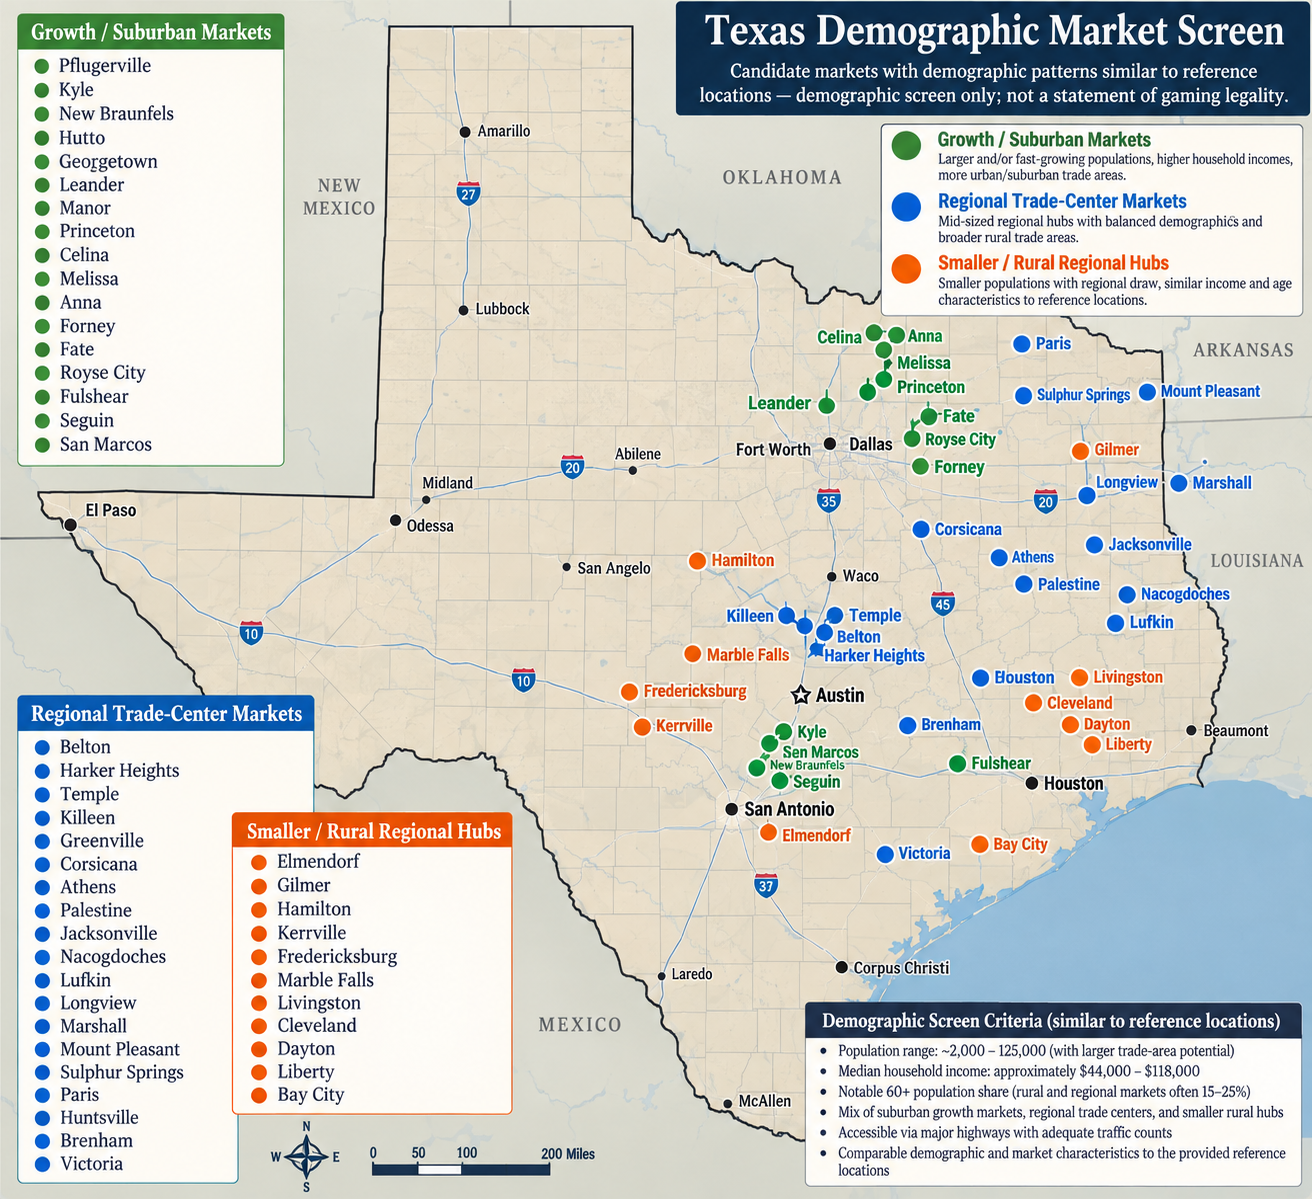
A demographic map can organize the search. DTX can connect it to the economics of the existing fleet and the realities of each prospective site, turning a broad set of areas into a documented expansion shortlist.
Three market hypotheses
Growth / suburban markets
Test household and employment growth against road access, new competition, real-estate cost, and the investment needed to serve the trade area.
Regional trade centers
Examine the catchment beyond city limits: workers, surrounding communities, through-traffic, gasoline and diesel demand, and competing stops.
Smaller / rural regional hubs
Assess drive distances, customer frequency, pass-through traffic, staffing and supply coverage, and whether the wider trade area supports the required sales.
Learn from existing locations
Identify which sites perform well and why. Separate market characteristics from execution: an experienced manager, unusual supplier terms, site maturity, or a one-off event may explain a strong result.
Define the real trade area
Start with the Dallas–Austin operating corridor. Compare site-specific drive times, access routes, and customer catchments. Treat wider-Texas opportunities as a separate expansion strategy with explicit management and supply costs.
Validate the evidence
Use dated Census population and household data, traffic counts, local development records, competitor locations, property costs, and field checks. Record geography, source period, uncertainty, and missing data; demographic similarity alone does not establish demand for a particular game.
Compare complete scenarios
Model fuel, store, and gaming assumptions together with capital, labor, occupancy, supplier terms, and ramp-up time. Compare base, expansion, and downside cases, including a case in which gaming contributes less than expected or is unavailable.
From a colored dot to a decision the owners can review
Build a candidate scorecard with owner-agreed criteria and weights, source-linked evidence, and clear reasons to advance, investigate, or defer each site. Test how the shortlist changes when assumptions change. Review permitted uses, operating requirements, and each proposed gaming arrangement separately before committing capital.
DBM provides the evidence foundation: retain the map, source datasets, property materials, supplier terms, model versions, review notes, and decisions in one project context. DTX develops the analysis and recommendation; each industry-specific mapping, model, or report is defined within the engagement.
Source framework: U.S. Census Bureau ACS guidance for choosing comparable demographic estimates and TxDOT traffic-count data for available daily, hourly, directional, and vehicle-classification measures. Record data vintage and reliability; distinguish mainlane and frontage-road counts. No candidate-market data has been validated or scored for this illustrative case.
What the first phase produces
- A reconciled operating baseline across fuel, convenience retail, and gaming.
- A documented shortlist of candidate markets and sites.
- Comparable growth scenarios showing contribution, shared costs, investment requirements, and cash needs.